After Friday’s Washington win over Northwestern, I noted on Twitter that the Huskies’ best performance of the season had come in the NIT. I wanted to see if that could be justified statistically. My method, same as for looking at UW’s football performance on a game-by-game basis, was to adjust Sagarin predictor rating for location and then subtract that from the actual outcome. You could do something similar with Ken Pomeroy‘s ratings, but I’m not sure how he adjusts for location.
So, for example, the Huskies should be expected to beat the Wildcats by 4.8 points at home, based on national home-court advantage figures. (In practice, Washington shows a slightly larger home/road split.) Instead, the margin of victory was 21. Take the former from the latter and the Huskies played 16.2 points better than normal on Friday night, which was in fact their best performance of the season.
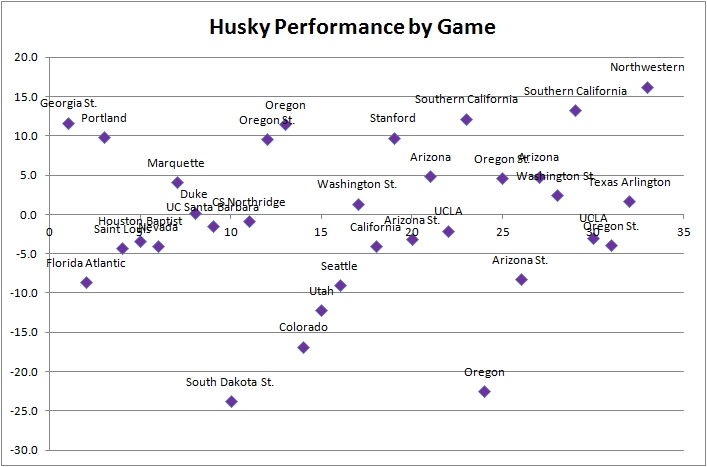
If we graph Washington’s game-by-game performance, it looks like this:

There’s not really a trend here. The Huskies’ best games were distributed fairly randomly throughout the season, as were their poor performances. So I’m not sure we learned much here except that Washington really did find its best gear on Friday.
Complete Ratings
Game                     Outcome    Rating
------------------------------------------
vs. Georgia St.         W, 91-74     11.7
vs. Florida Atlantic    W, 77-71     -8.6
vs. Portland            W, 93-63      9.8
at Saint Louis          L, 77-64     -4.3
vs. Houston Baptist     W, 88-65     -3.4
at Nevada               L, 76-73     -4.1
Marquette (N)           L, 79-77      4.1
Duke (N)                L, 86-80      0.2
vs. UC Santa Barbara    W, 87-80     -1.5
vs. South Dakota St.    L, 92-73    -23.8
vs. CS Northridge       W, 74-51     -0.9
vs. Oregon St.          W, 95-80      9.5
vs. Oregon              W, 76-60     11.5
at Colorado             L, 87-69    -16.8
at Utah                 W, 57-53    -12.2
vs. Seattle             W, 91-83     -9.0
vs. Washington St.      W, 75-65      1.4
vs. California          L, 69-66     -4.1
vs. Stanford            W, 76-63      9.8
at Arizona St.          W, 60-54     -3.2
at Arizona              W, 69-67      4.9
vs. UCLA                W, 71-69     -2.1
vs. USC                 W, 69-41     12.2
at Oregon               L, 82-57    -22.5
at Oregon St.           W, 75-72      4.6
vs. Arizona St.         W, 77-69     -8.3
vs. Arizona             W, 79-70      4.8
at Washington St.       W, 59-55      2.5
at USC                  W, 80-58     13.3
at UCLA                 L, 75-69     -3.0
Oregon St. (N)          L, 86-84     -3.9
vs. Texas Arlington     W, 82-72      1.7
vs. Northwestern        W, 76-55     16.2

Hopefully they play that well again on Tuesday.