First, some big news: we have a logo!![]()
After discussing that, in this week’s jam-packed Peltoncast your hosts discuss Kevin’s computer (and its Knicks projection) becoming a news story, talk about Seahawks pessimism and the team’s third-down issues, preview their Thursday night visit to Arizona, relate the feeling of helplessness created by Marcus Mariota, grade the Huskies at the midpoint of their season, study the meaning of their penalty woes (see below), make this week’s NFL’s picks, recap last week’s special Gameday tailgate and finish up by comparing the Kansas City defense to the ’85 Bears in terms of fantasy value.
DOWNLOAD/STREAM THIS WEEK’S PELTONCAST | Find on iTunes
INTRO: Kevin’s famous computer
9:00 Seahawks: are people too worried about a 5-1 team? Plus investigating third-down issues and looking ahead to Thursday’s game at Arizona (listen to the Seahawks section)
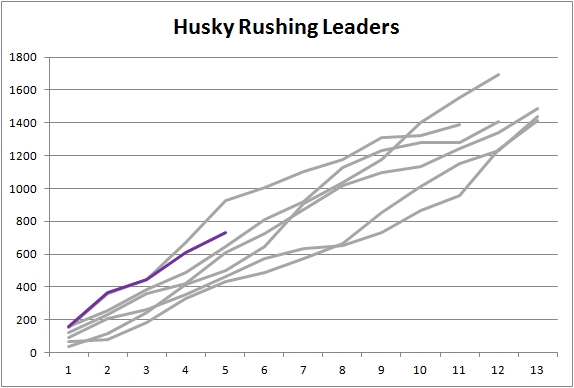
24:00 Huskies: recapping Saturday’s loss to Oregon, midseason grades, penalty study (listen to the Huskies section)
42:00 NFL picks
45:00 Tailgating: Getting up early for Gameday and cream cheese takes our tailgate to the next level (listen to the tailgating section)
54:00 Fantasy – A friendly wager on this weekend’s Peltoncast showdown and comparing the Chiefs defense to the ’85 Bears
This Week’s Links
– Explaining SCHOENE’s prediction for the Knicks
– New York Post: “Knicks scoff at computer’s 37-win prediction”
– Why Kobe ranks so low in #NBArank
– Kevin on the Mix-Minus Podcast
– Jerry Brewer on the Seahawks’ issues and high expectations
– Football Outsiders FEI Ratings
2013 NCAA Penalty Research
In the analysis of the first half of the Huskies’ season, we discuss the role of penalties. Washington has been called for the second-most penalties per game in the nation and leads all FBS teams in penalty yardage.
The research with which I’m familiar on penalties and team success has been conducted in the NFL. In Pro Football Prospectus 2007, Aaron Schatz and Bill Barnwell found that a small negative correlation (-0.31) between offensive penalties and wins (that is, teams with more penalties perform worse) but little relationship between defensive penalties and wins.
Using data from Sports-Reference.com, I quickly studied the relationship between penalties and yardage — both adjusted per 140 team plays on offense and defense to mitigate the effect of fast-paced offenses like UW’s that lead to more plays per game — and success and found a slightly positive correlation (0.15) between both and Sports-Reference.com’s Simple Rating for each team. Here’s how that looks graphically:
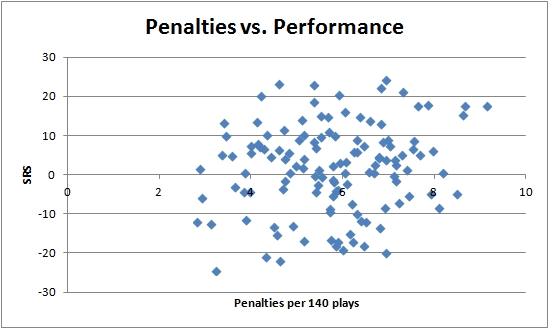
Note that the three teams in the country that have been penalized most frequently — UCLA (9.1 per 140 plays), Florida (8.7) and UW (8.6) are all top-20 teams. But really, the data from this limited sample show very little relationship between penalties and team success in the NCAA this season.
In case you were curious, despite the reputation for overofficiating (and the Bruins and the Huskies drawing laundry by the load), the Pac-12 doesn’t lead the nation in penalties per 140 plays (including non-conference games). That honor actually belongs to the new American Athletic Conference:
Conference Pen/G   Yd/G   Pen140 Yd140
--------------------------------------
American    6.9    58.8    6.8    58.5
Sun Belt    6.6    54.4    6.5    53.3
Pac-12      6.8    57.8    6.3    53.5
Big 12      6.4    56.4    6.1    53.1
ACC         5.8    47.2    5.8    47.1
SEC         5.6    45.3    5.8    46.5
MAC         5.6    49.5    5.6    49.4
CUSA        5.5    45.8    5.4    44.9
Big Ten     5.5    48.1    5.4    47.2
MWC         5.3    50.0    4.8    45.9

Average     5.9    50.4    5.8    49.1
Blame Arizona State: The Huskies’ opponent on Saturday is at the opposite end of the spectrum, committing 3.4 penalties per 140 plays, the nation’s seventh-lowest average. So if you see a flag during the game, assume it will go against Washington.